Close

Jasmin Joseph

Data & Backend Engineering | Building pipelines, service layers, and data systems for analytics and applications

About Me

I'm an engineer with 10+ years of experience working at the sweet spot where data infrastructure meets backend systems. I design and build robust pipelines, service layers, and data products that power both analytical workflows and real-time applications—ensuring they deliver reliable value day in and day out.


At the core, I obsess over correctness, resilience, and observability. I want systems that don't just work in ideal scenarios but thrive under pressure, scale gracefully, and give clear signals when something's off. My toolkit includes Python and SQL as daily drivers, paired with orchestration tools like Airflow, dbt, and Dagster, plus FastAPI for clean, performant APIs. I've handled both batch and streaming patterns, deploying to GCP and AWS with containers and managed services to keep things efficient and maintainable.


While I'm happy to jump in on analytical workflows or dashboards when the team needs it, my real passion lies in crafting the foundational systems and data models that make high-quality insights possible in the first place. I thrive on cross-team collaboration — working closely with backend, platform, and analytics folks to ship data products that move the needle.


Whether it's turning raw streams into actionable intelligence or building APIs that quietly power everything else, I enjoy solving the hard, behind-the-scenes problems that let the rest of the stack shine.

Projects

Earthquake Data Pipeline

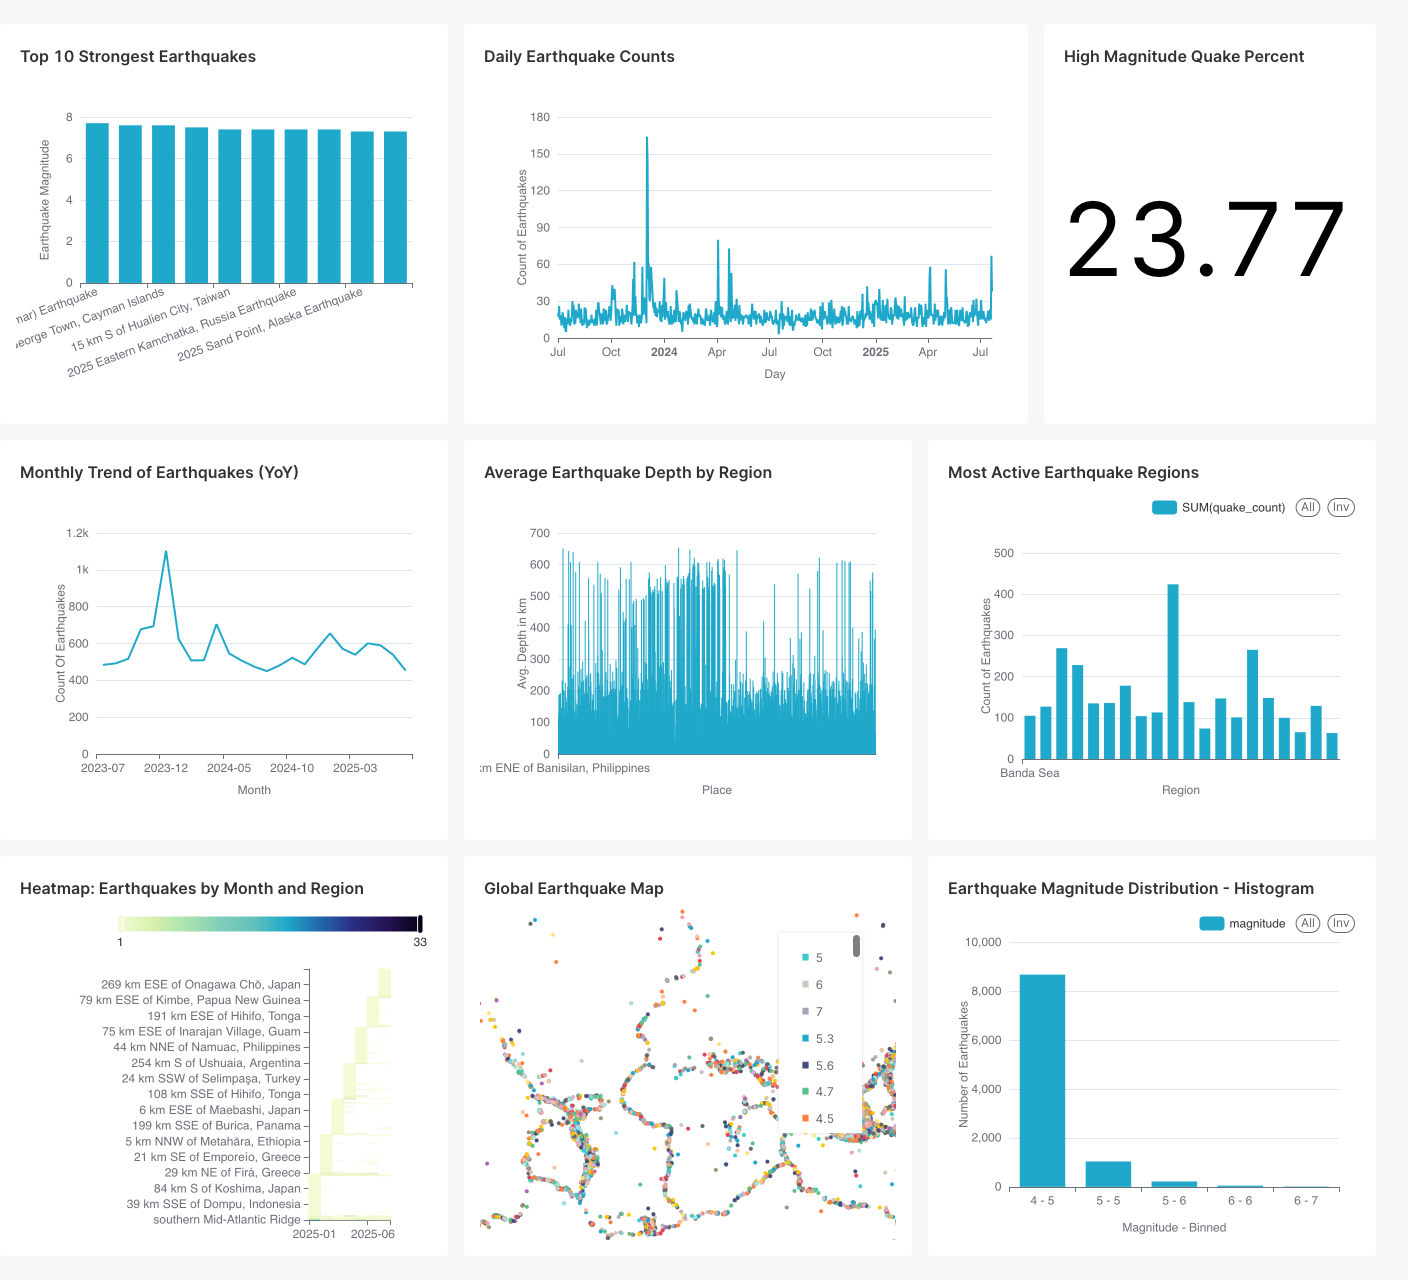
A fully automated data pipeline for processing and analyzing global earthquake events. The project includes:

  • Ingestion: Idempotent loading from USGS API with raw JSON preservation
  • Transformation: dbt models with data quality tests (staging → marts)
  • Orchestration: Apache Airflow with configurable backfills
  • REST API: FastAPI service with circuit breaker, exponential backoff, and Prometheus metrics
  • Visualization: Apache Superset dashboards with geospatial and statistical insights
  • Storage: PostgreSQL with schema separation and connection pooling

Demonstrates end-to-end data engineering and backend development with a focus on reliability and observability.

View Project

SQL Data Warehouse

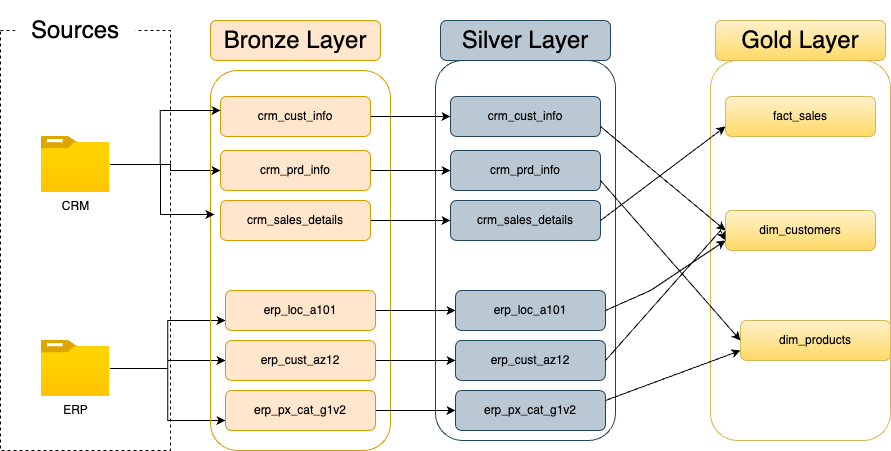
A modern PostgreSQL-based data warehouse designed to support scalable analytics and reporting. This project demonstrates end-to-end data engineering practices, including:

  • Data modeling & schema design using the Medallion (Bronze–Silver–Gold) architecture.
  • ETL pipelines to extract, transform, and load raw transactional data.
  • Data quality checks and validation for accuracy and reliability.
  • Analytics-ready views for business intelligence and performance insights.
  • Query optimization for efficient analysis at scale.

The project highlights best practices in data architecture, integration, and transformation, delivering clean, reliable datasets ready for business decision-making.

View Project

Data Visualizations

Tableau Dashboards

Explore my collection of interactive Tableau dashboards published on Tableau Public:
View My Tableau Portfolio

Featured Dashboards

HR Analytics Dashboard

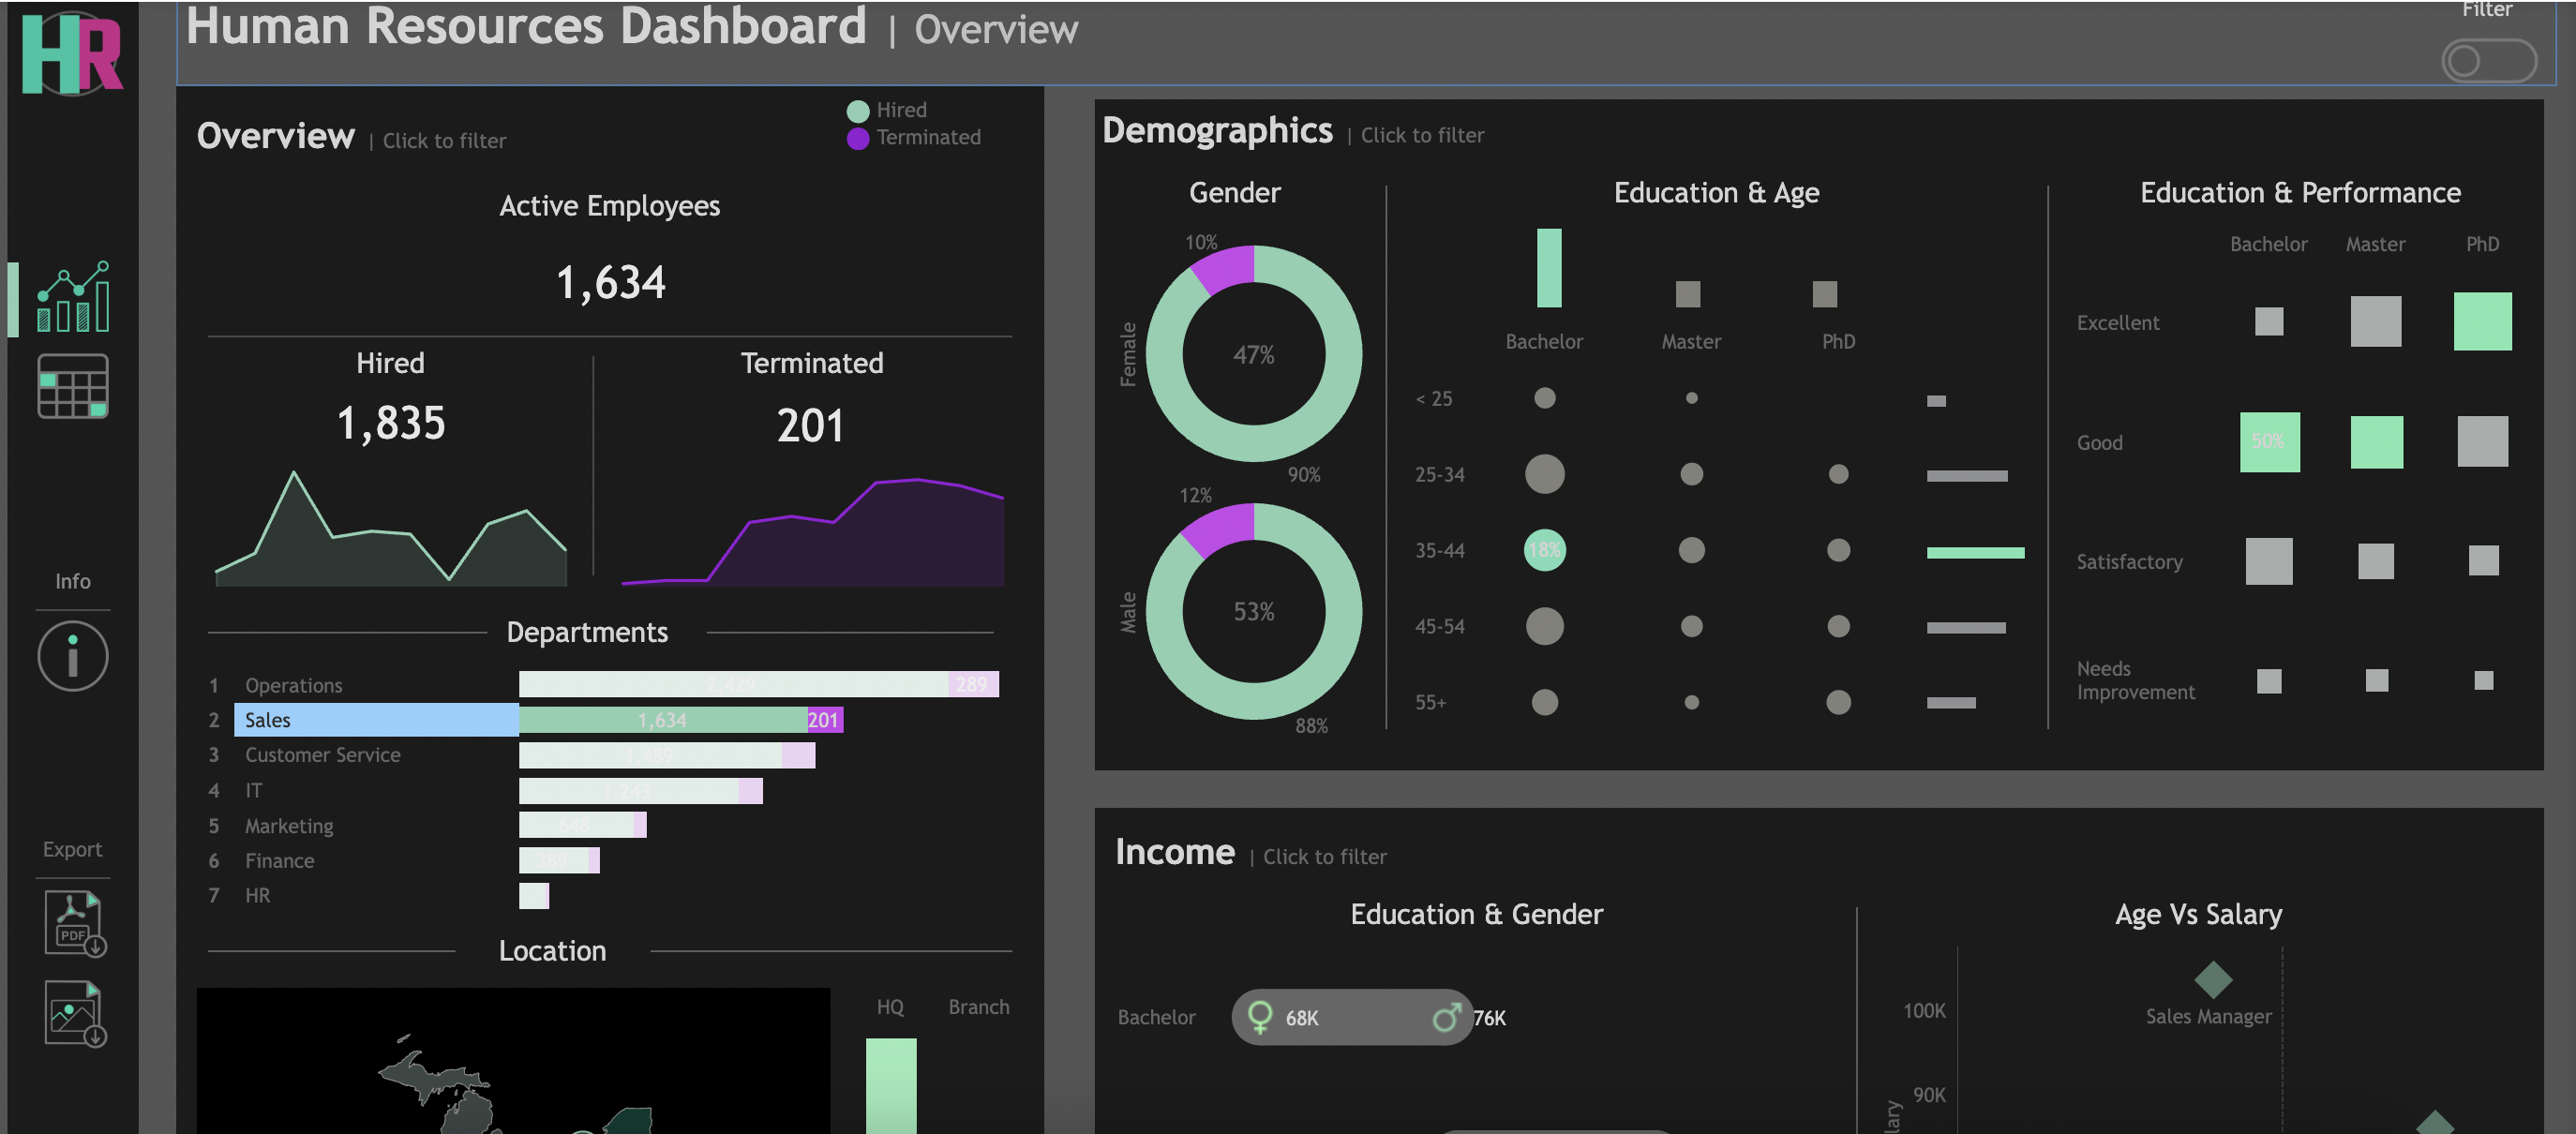
An interactive Tableau dashboard built to help HR managers analyze workforce data through both high-level summaries and detailed employee records.

  • Summary View includes three analytical sections:
    • Overview: Displays total hires, active employees, and terminations; visualizes hiring and termination trends over the years; breaks down employees by department, job title, and location; and compares HQ vs. branch distributions.
    • Demographics: Highlights gender ratio, age groups, and education levels while exploring correlations between education and performance ratings.
    • Income Analysis: Examines salary comparisons by education and gender and analyzes how salary varies with age across departments.
  • Employee Records View: Provides a comprehensive, filterable employee list (name, department, position, gender, age, education, salary) to enable detailed individual-level analysis.
  • Designed with interactive filters and dynamic sections, empowering HR teams to quickly move from strategic insights to granular employee data for better decision-making.
View Dashboard

Sales and Customer Performance Dashboard

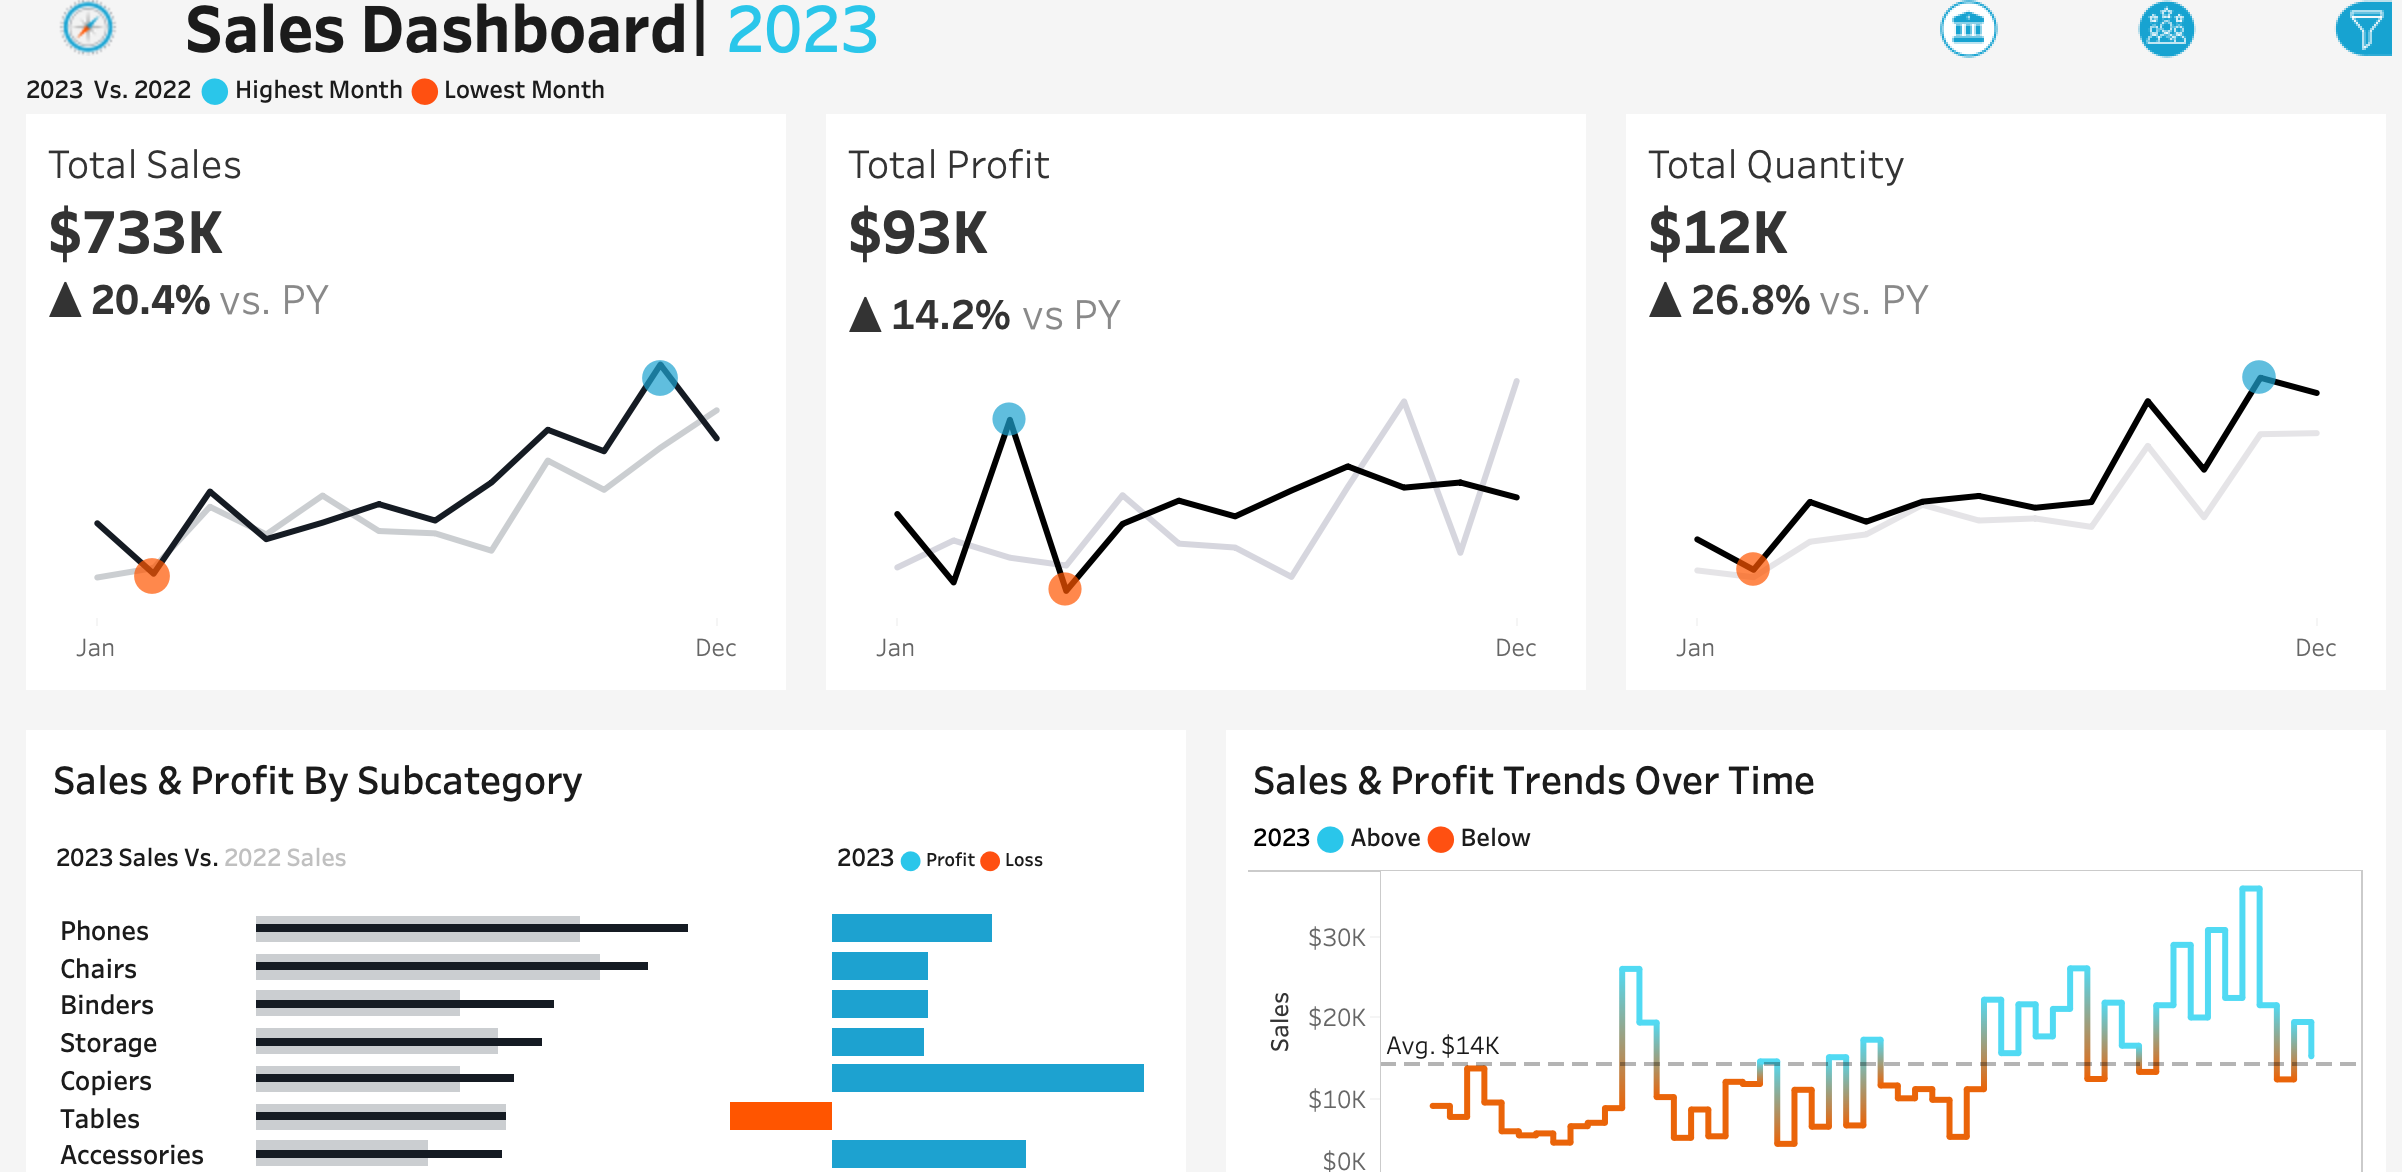
A dual-dashboard visualization designed to analyze sales trends and customer performance through interactive KPIs and filters.

  • The Sales Dashboard displays key metrics:Total Sales, Profit, and Quantity, along with sales and profit by subcategory and trend analyses over time, filterable by year.
  • The Customer Dashboard highlights Total Customers, Sales per Customer, and Total Orders, supported by visuals showing customer distribution by order count and top customers by profit.
  • Built with interactive navigation buttons to switch seamlessly between dashboards, enabling smooth exploration.
  • Demonstrates advanced Tableau skills in dashboard linking, parameter control, and performance optimization for a business-ready visualization experience.
View Dashboard

Skills

Get in Touch

Interested in working together or have a question? Let’s connect.

LinkedIn: linkedin.com/in/jasmin-joseph-a3430a68